Adding historical writing to a new MindLog
If you have been keeping a journal or saving examples of your writing over time, with MindLog, you can create an almost instantaneous image of the growing complexity of your thinking.
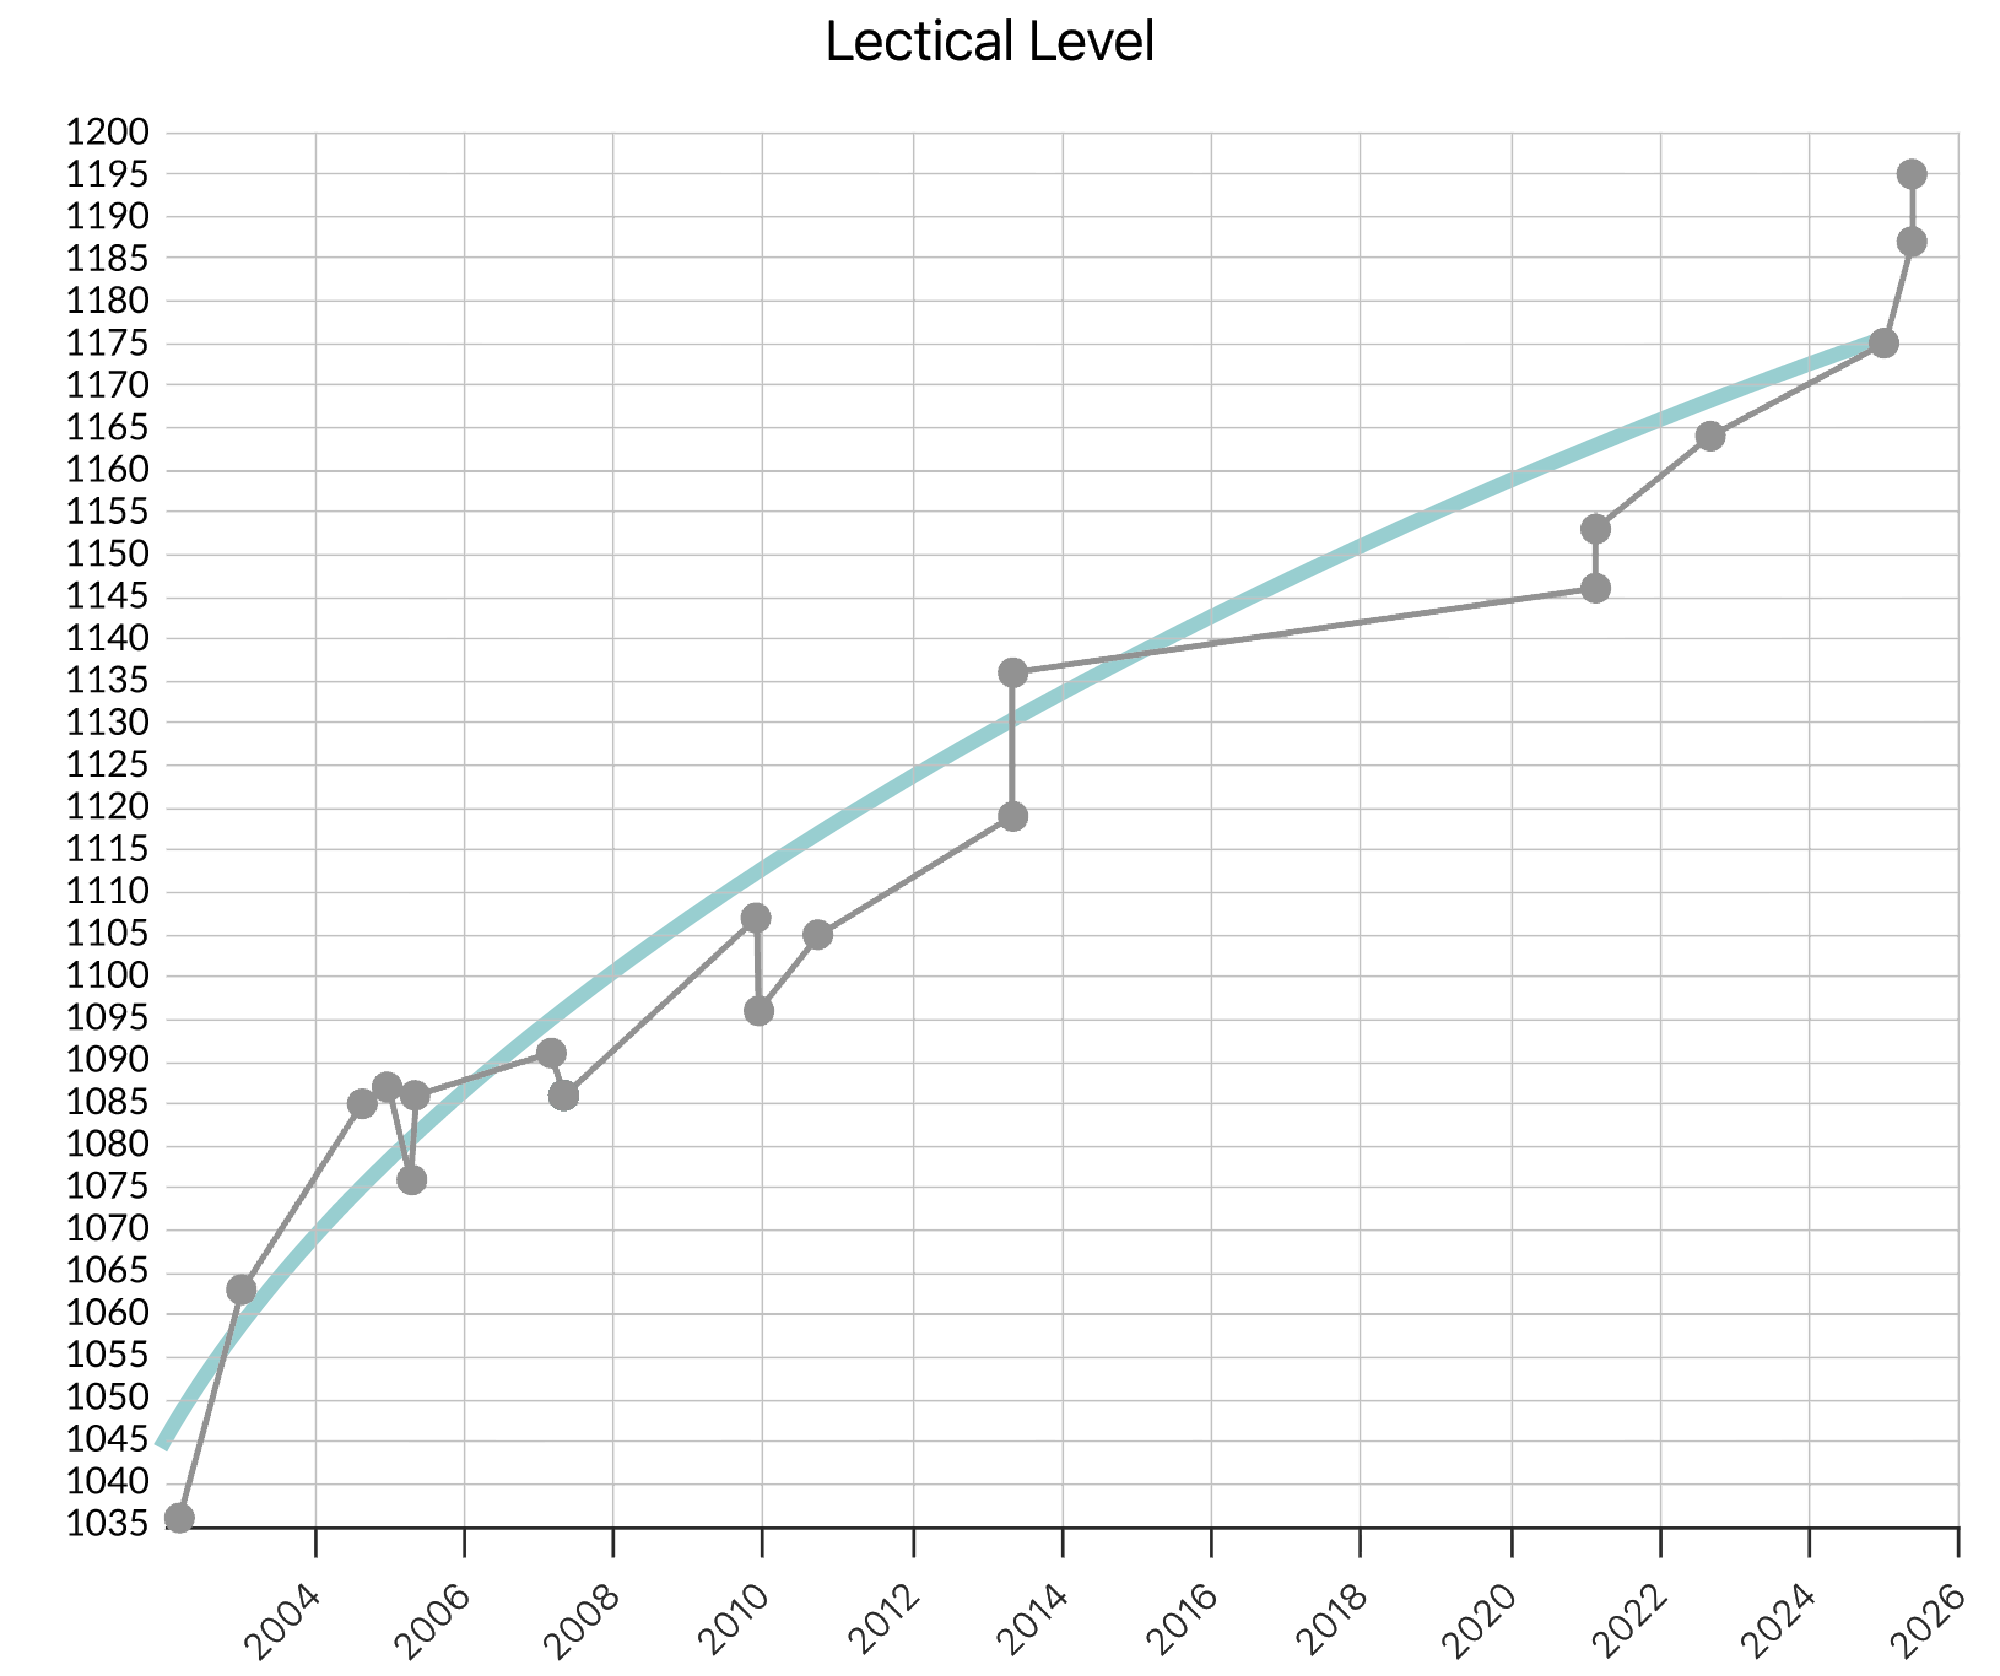
The growth plot (and curve) shown above was created by a learnaholic Mindlogger who wanted to see how he had developed from adolescence onward. So, he gathered up all of his written work from the age of 13 onward and entered the texts into MindLog in sequential order.
This is a simple thing to do. Just follow the guidelines below.
Basic requirements
There are a few things you will need to consider before entering historical writing into MindLog.
- You will need to purchase the Essays version of MindLog. The basic Essays version includes 10 essay-length responses.
- This works best with a brand new MindLog. Because MindLog's scoring system always scores the most recent 4-6 entries, historical data can only be entered into a brand new MindLog.
- The birth year provided in your profile must be accurate. If you aren't sure if it is, you can edit your profile on your profile page.
- It's best if historical writing entered into MindLog has all been done without outside support. Anything written “open book” style will make scores more difficult to interpret. Any use of AI, including grammar checkers, will make scores meaningless. If you do enter writings that were supported in any other way, indicate how they were supported in the survey at the bottom of the entry page. That will help you with interpretation later.
- You will need “date written” and “grade” information for MindLog's entry form. This information must be as accurate as possible for every single entry, because it allows MindLog to set the correct maximum character limits for accurate scores.
- You'll need enough material to meet minimum character counts: CLAS (our scoring system) won't work unless minimum character counts are met. Character accounts are based on grade (educational information) you provide on the entry page.
- Essay entries should contain writing done within a narrow(ish) timeframe: In adulthood, the timeframe could be as long as a year or two. In childhood, 6 months to a year might work better.
Growth curves: Growth curves like the one shown in the graph at the top of this page are not currently available.
Prompt names and descriptions
There are no hard and fast rules for writing prompt names and descriptions in MindLog, but entering helpful prompt names and descriptions will make it easier for you to identify the records for each scored group of 4 entries. For example:
Prompt name: Grade 5, journal entries, date X – date Y.
Prompt description: Topics include friendship, problems at school, and an upcoming camping trip.
Later, you will be able to search through your MindLog entries using the words in prompt names and descriptions. For example, you may want to look at how your way of thinking about friendship has changed over the years or want to show your granddaughter how you thought about friendship when you were her age.
Is entering historical writing worth the effort?
Aside from the coolness factor for learnaholics like us, there are a few compelling reasons for entering historical writing, especially if you're planning to use MindLog to support your personal learning journey.
Growth plots and curves confirm that we have grown. This may seem like a given, but many of us rarely receive clear external confirmation that we are growers. A little affirmation can be motivating.
Growth plots help us see when we've learned: Charting growth patterns during different phases of our lives can help us see how our activities have affected our growth—and help us decide what we'd like to do next as learners.
Admissions: MindLog plots and curves are likely to become evidence you can use to demonstrate your readiness for a variety of roles or academic programs. (This is already happening.)
MindLog's plots and growth curves can help with early detection of changes in mental functioning. Historical writing provides information about your development to date that is often required to calculate a reliable growth curve. MindLog scores that diverge significantly from projections based on your growth history can provide an early warning sign of mental issues.