How scoring & growth charts work
Please send us your questions about growth charts.
We’ll use them to further develop the information on this page.
The Lectical Scale
During the last three decades much has been written about the Lectical Scale, Lectical Assessment, and CLAS (our electronic scoring system). If you’d like to dig into the technical details, the three links provided in the previous sentence will get you going.
In this document, we provide the basic information you are likely to find useful as a Mindlogger, starting with the following video, which offers plain English description of Lectical Levels:
Lectical Levels in MindLog
The Scores awarded in MindLog are Lectical Scores. They are calculated by CLAS, our computerized developmental assessment system, and range from 650 (early speech) to 1225 (highest recorded scores). In adulthood, scores can range from 900 to 1225. The vast majority of adults perform in the range between 1000 and 1120.
A Lectical Score represents the complexity level of a particular text or group of texts. In MindLog™, scores are awarded once a Mindlogger has written enough to meet the character count required for accurate scoring—usually every 4–6 reflections in MindLog Reflections and a single essay in MindLog Essays.
Once you have provided enough written material for CLAS to calculate a reliable Lectical Score, your first Lectical Score will appear near the top of any MindLog entry page. When you receive your second Lectical Score, a growth chart will appear. Each time you receive a score, it will be added to your growth chart.
Over time, as more entries are scored, (and if you always write your responses without outside help) a clear growth pattern will emerge.
Here are a few things to take into account when viewing your growth chart:
Performance is variable
Don’t expect to perform consistently at the same level. Many factors affect performance—including state of mind, energy level, level of effort, engagement, health, hunger, level of wellbeing, hormone levels, and the content being explored.
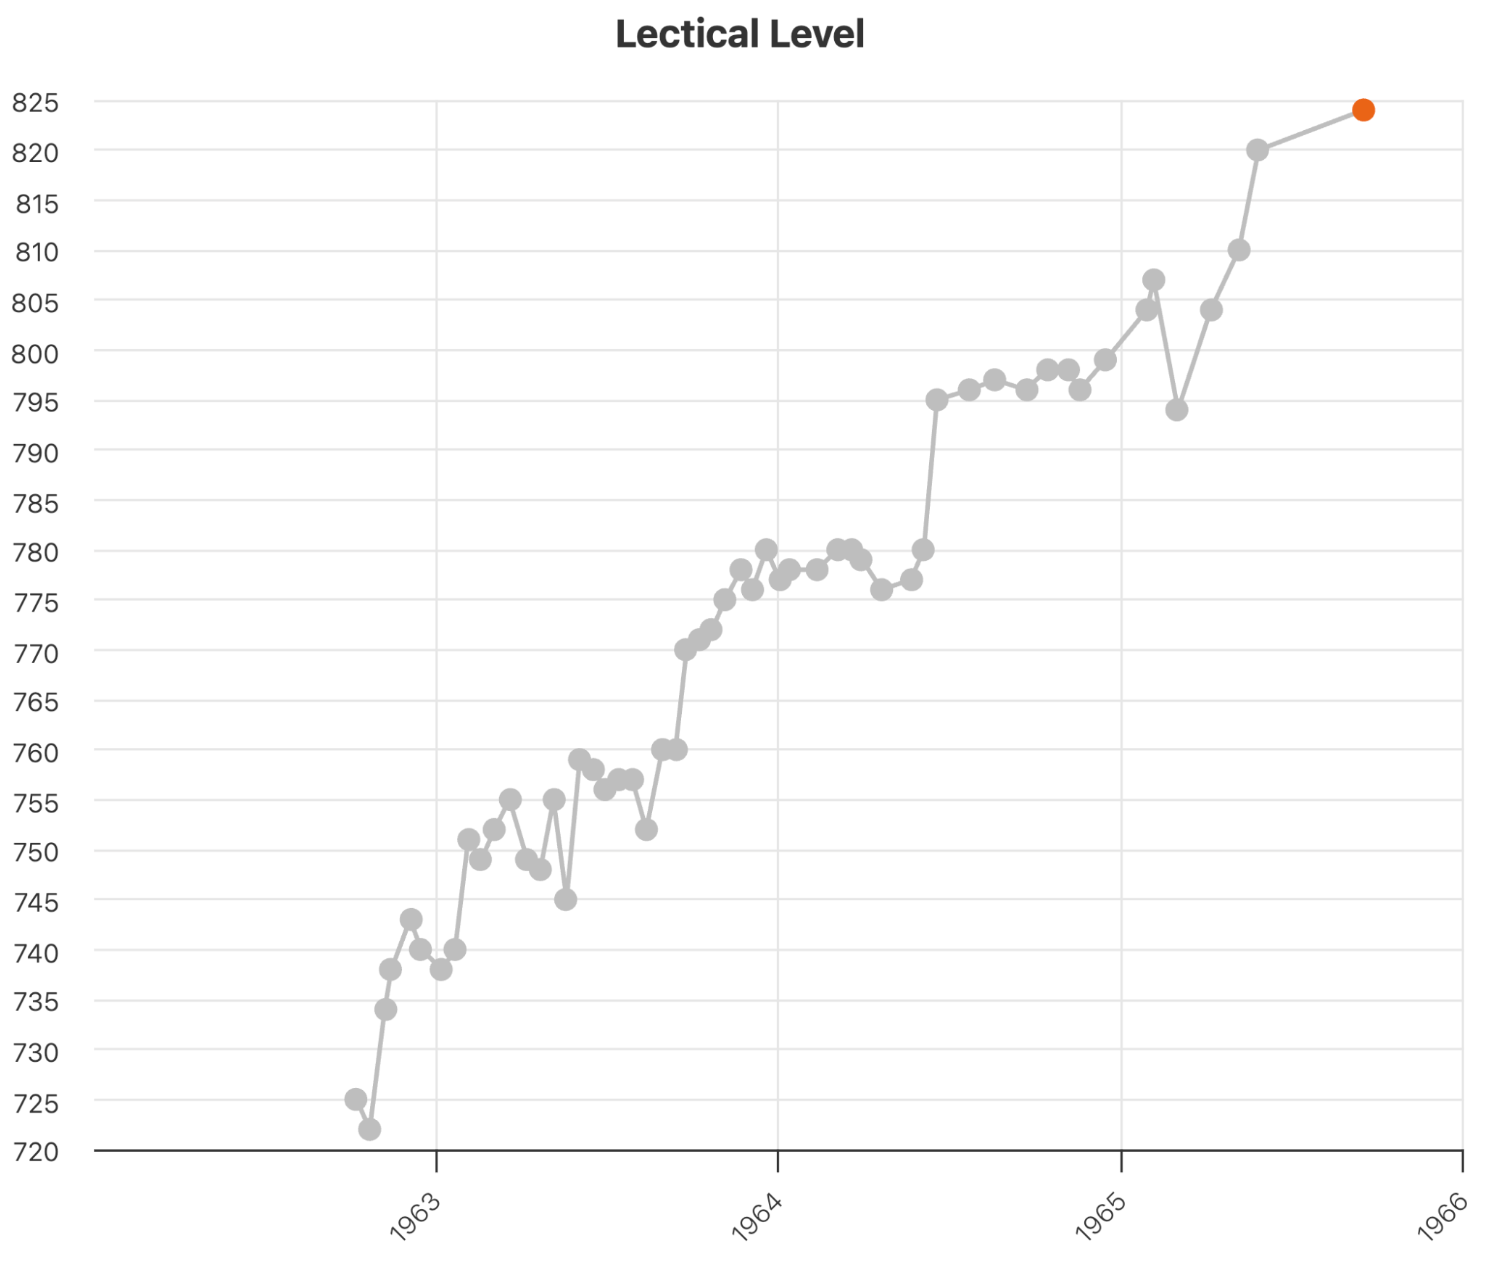
The figure below shows the growth chart of a very young child named Eve, whose speech was recorded every-other week for just under three years. From research on young children, we know that variable performance like Eve's is the rule in early childhood, although in her case, variability does seem to lessen a bit with age.
Keep variability in mind when viewing your own growth chart. As an adult, your first few scores may seem to have no pattern at all.
Mental growth is not continuous
In addition to being variable, mental growth, like physical growth, occurs in fits and starts. A close look at Eve’s growth chart reveals periods of rapid growth followed by periods of slower growth. Researchers have observed similar patterns in older children and adolescents. MindLog makes it possible for researchers to learn much more about these fits and starts, and can even help Mindloggers build skills for managing their own growth more effectively.
Raw data source for Eve's growth chart: Brown, R. (1973). Development of the first language in the human species, American Psychologist 28(2):97-106 DOI: 10.1037/h0034209
Mental growth slows at higher Lectical Levels
The higher your score, the longer it will take to see clear evidence of growth in your MindLog growth chart. This is partly because individual development through higher, more complex levels takes longer than development through lower, less complex levels.
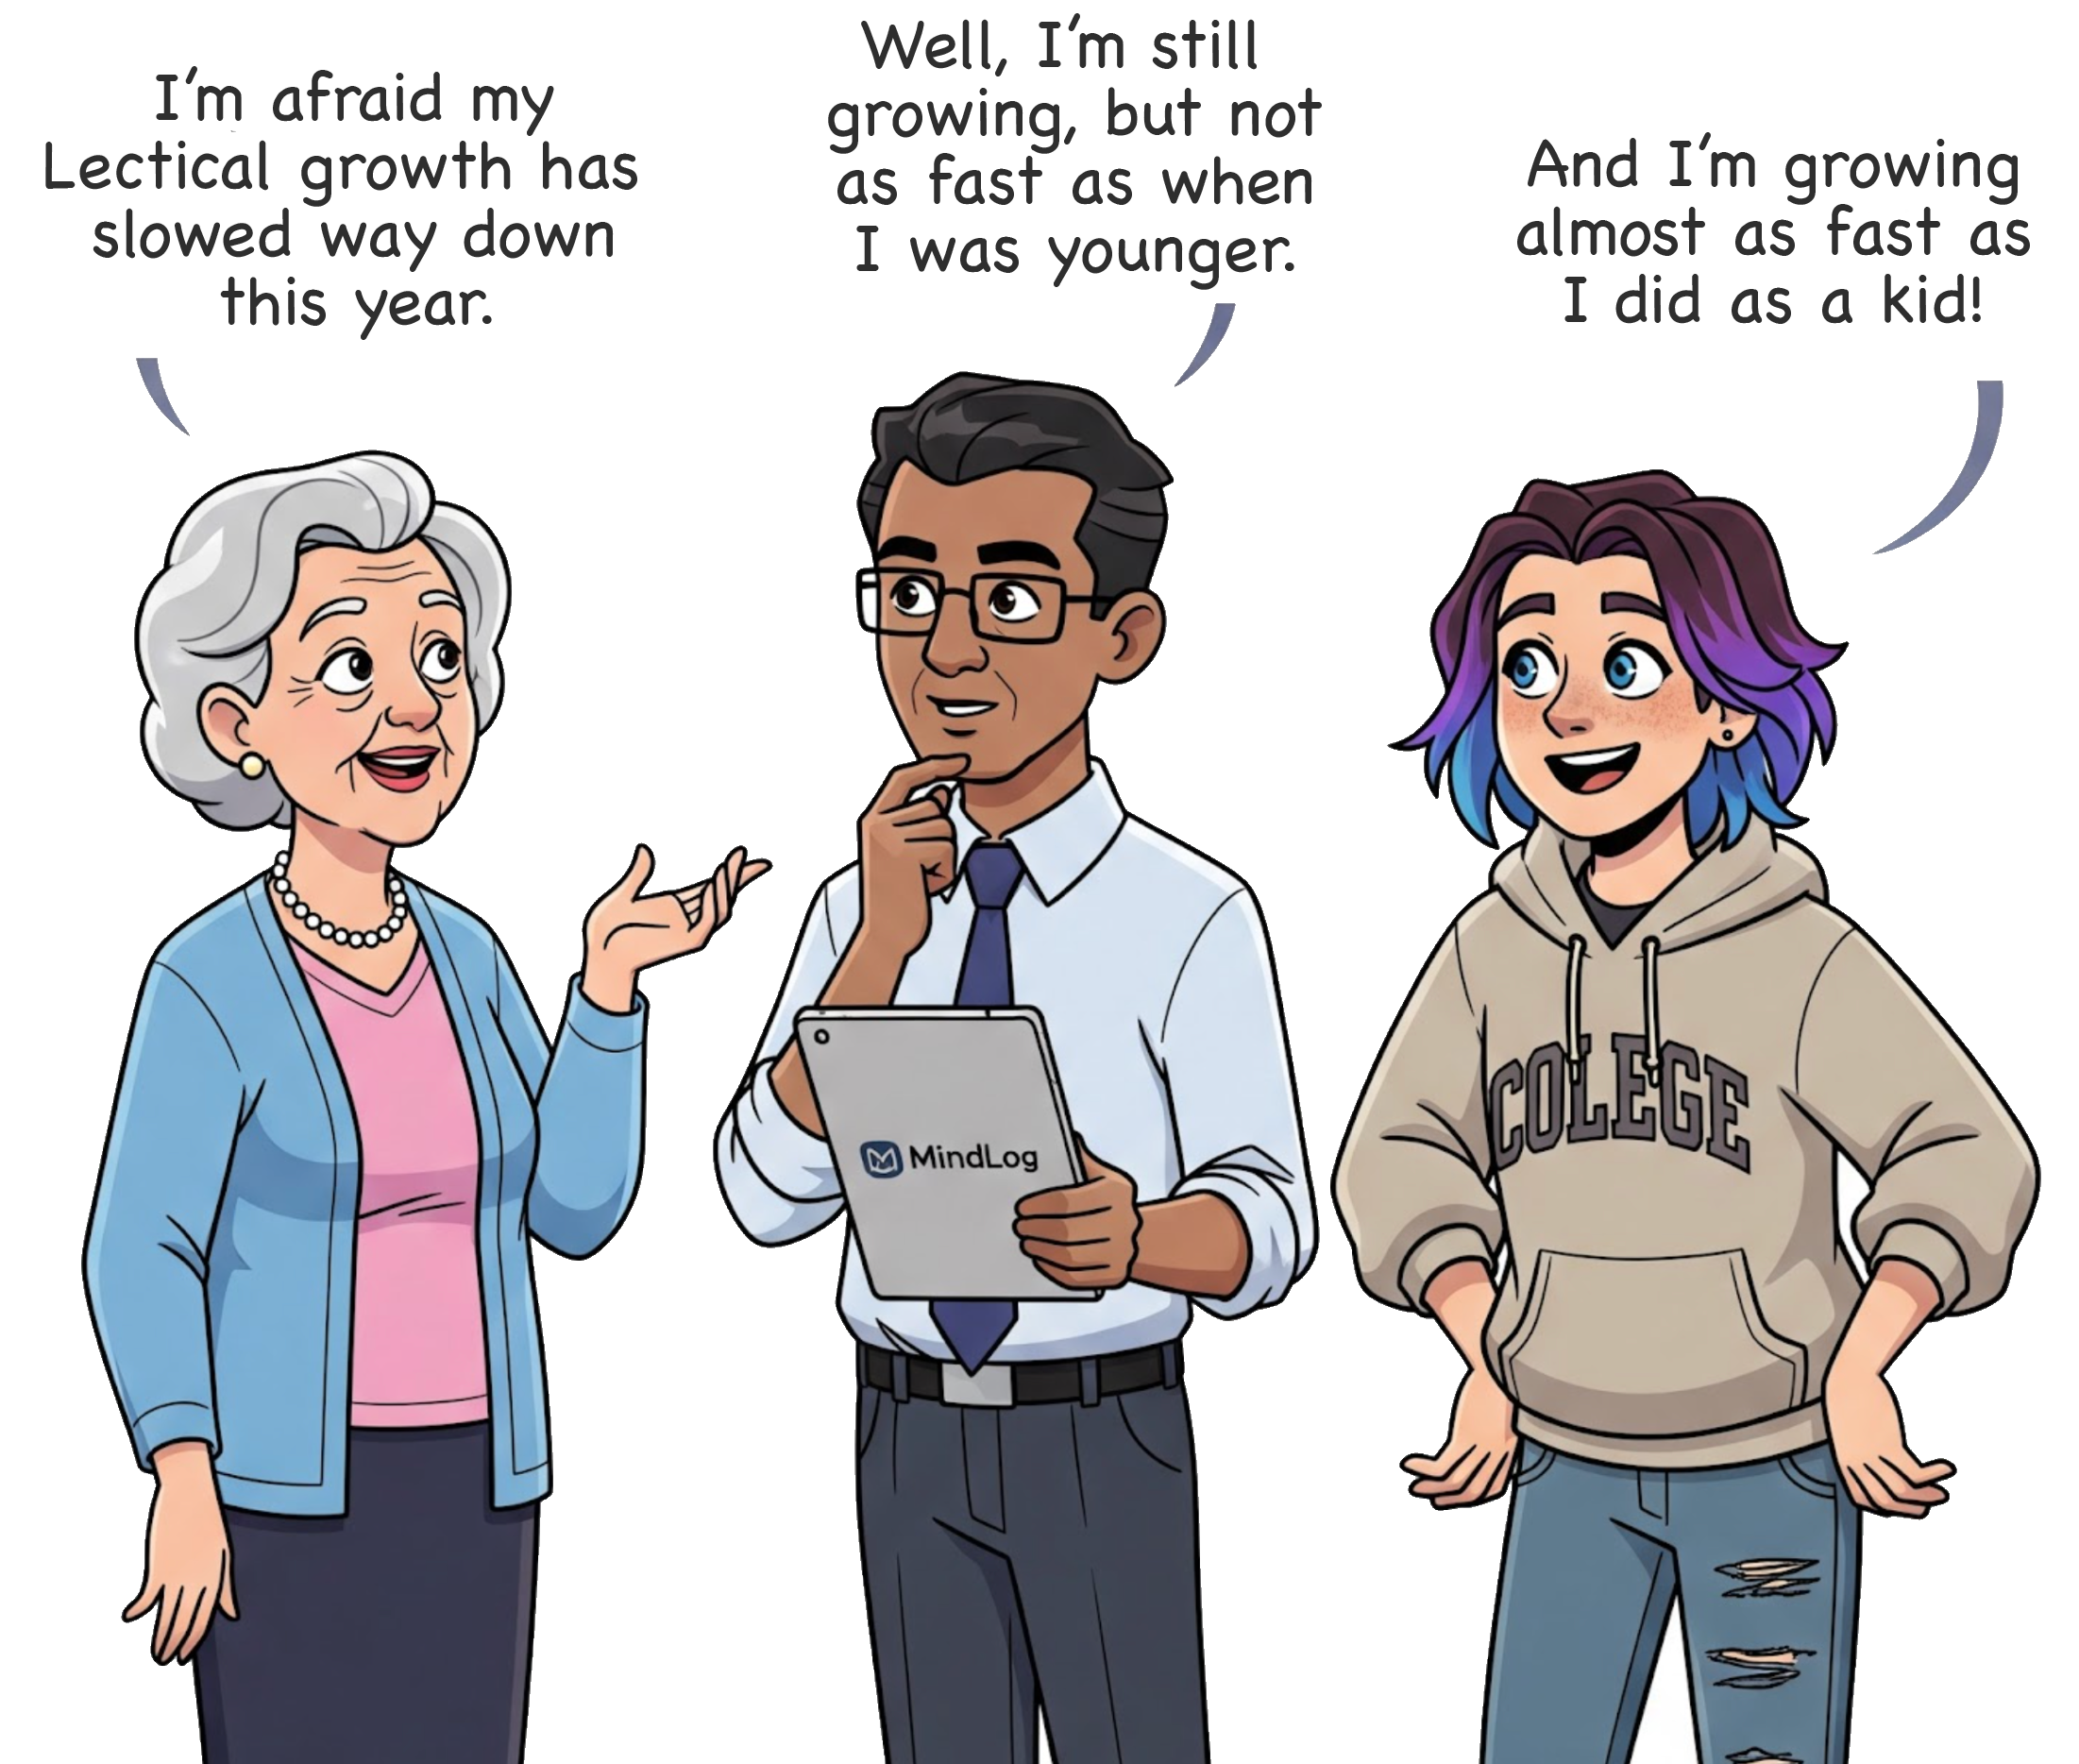
Mental functioning and aging
Lectical growth also slows as we age, regardless of Lectical level. MindLog offers meaningful mental stimulation for aging adults, while providing a powerful way to monitor mental functioning. Dr. Dawson is monitoring her own mental functioning with MindLog as she ages, and Lectica is actively seeking research opportunities in this area.
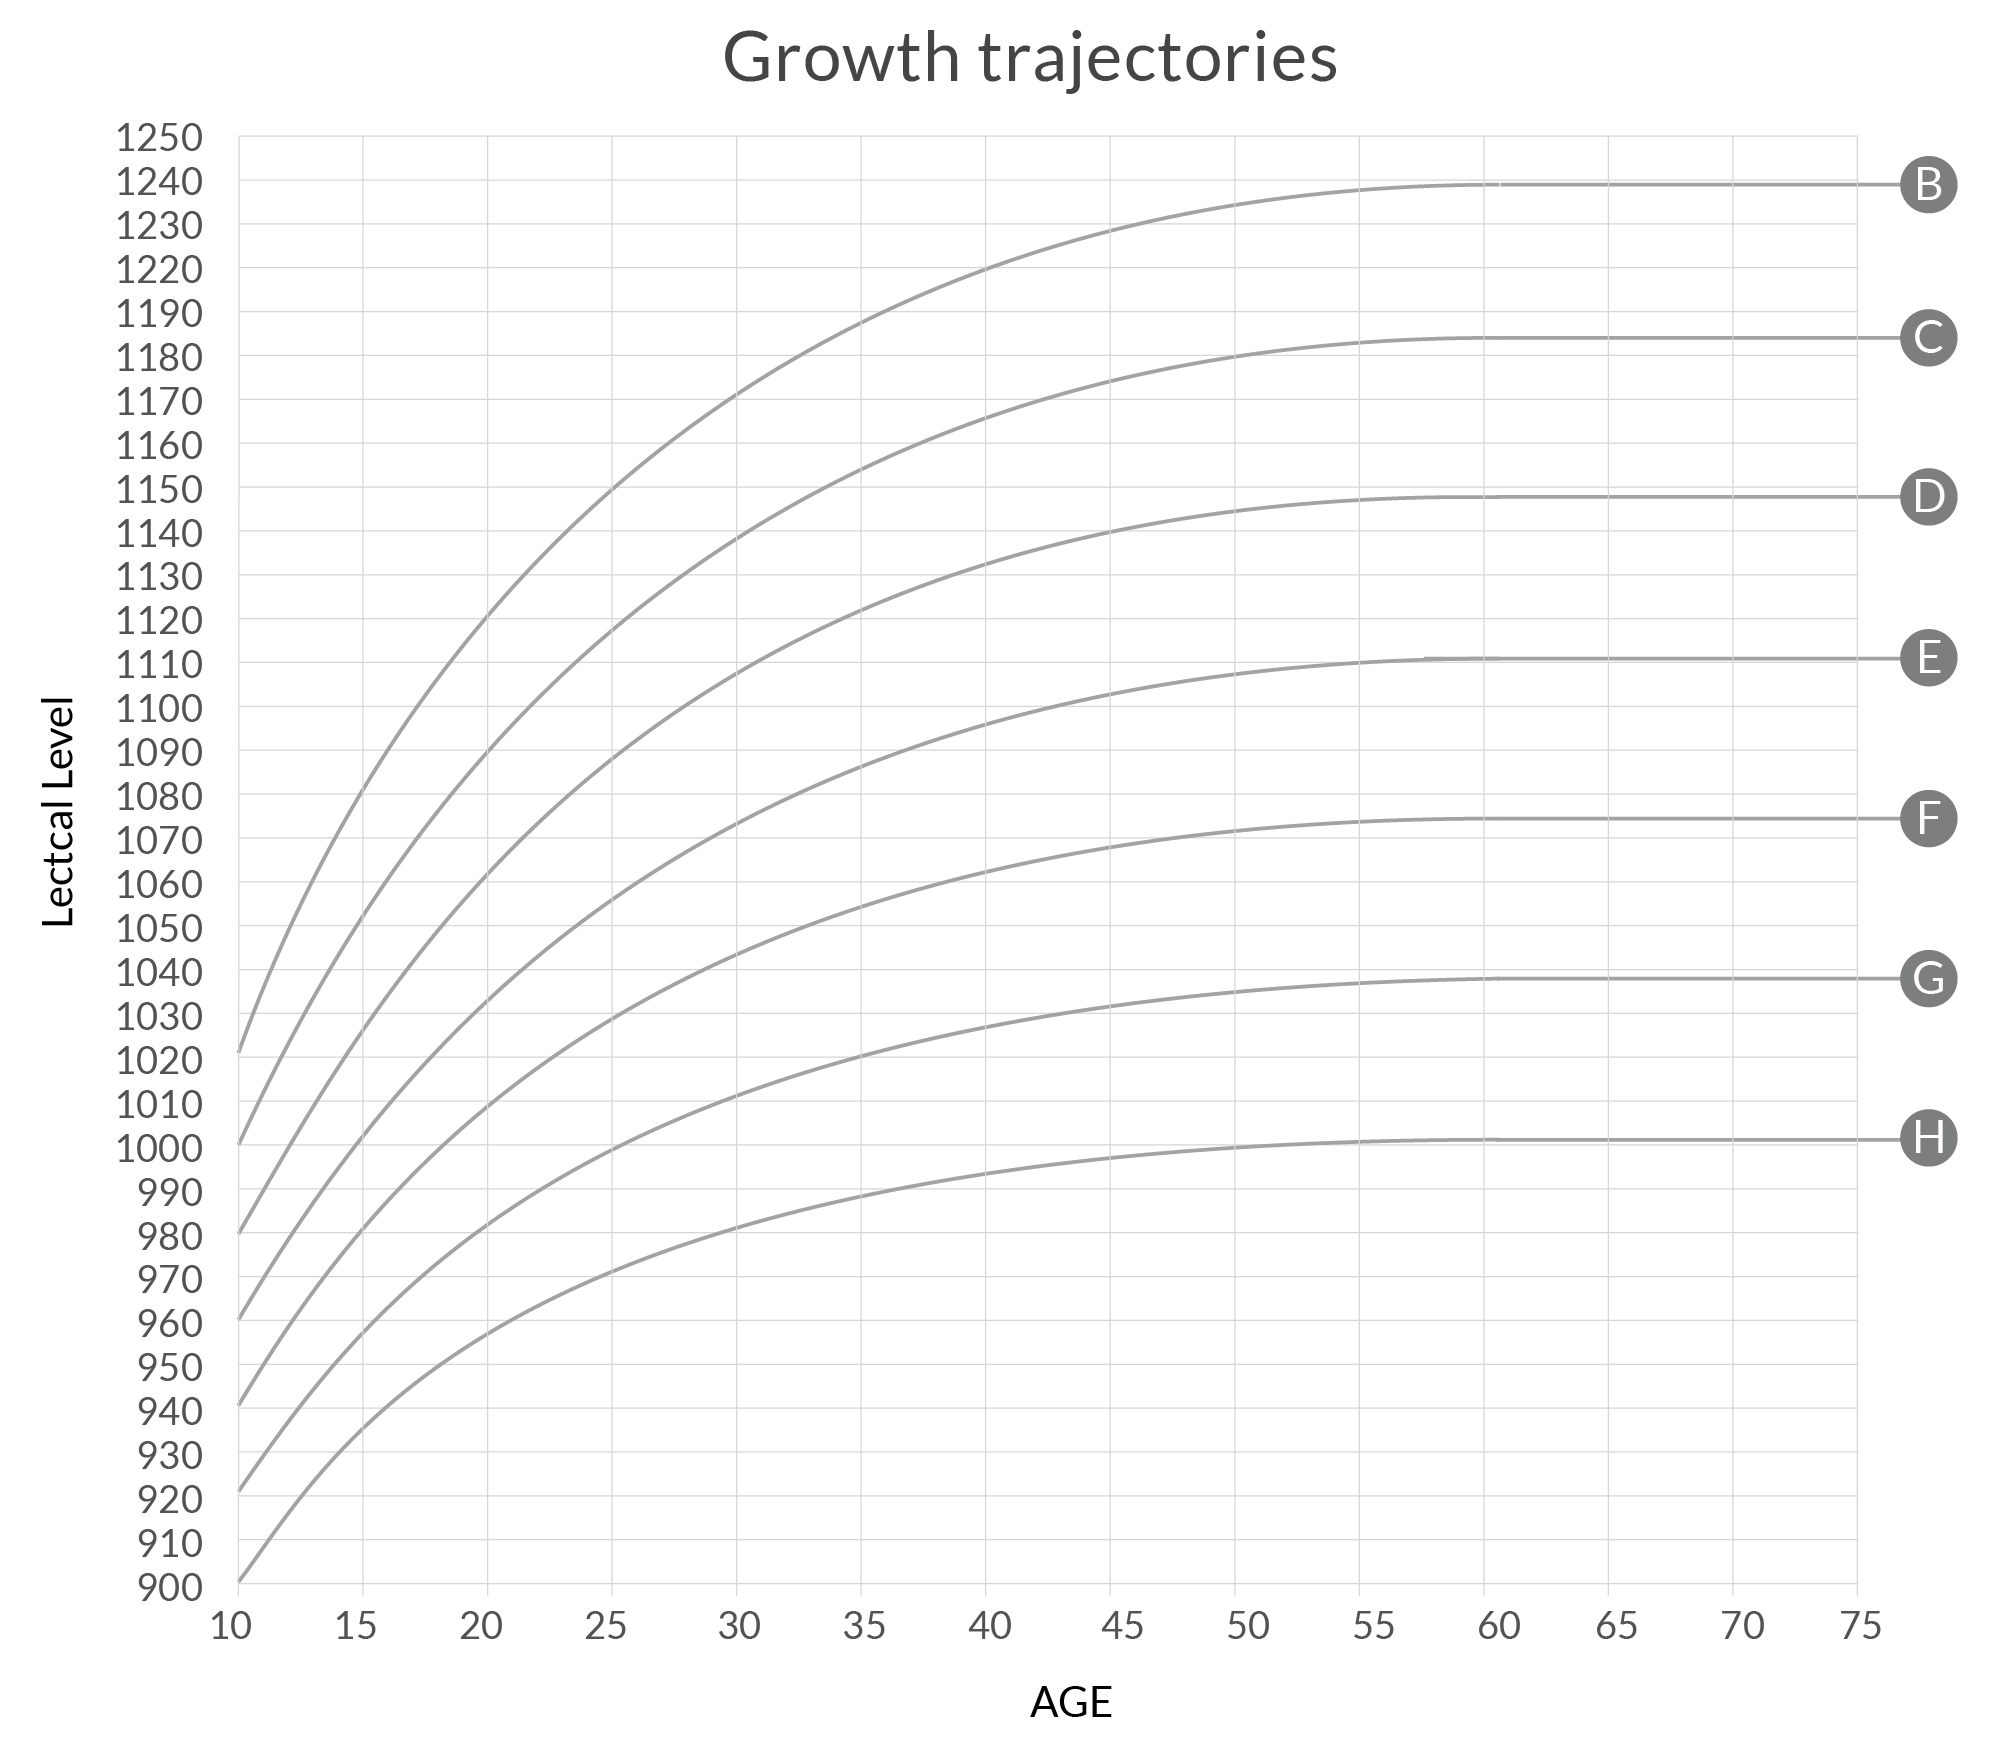
Typical growth trajectories
The graph below represents a series of “averaged” growth curves based on our research to date. We've included it here with reservations.
We deliberated long and hard before publishing this graph on the MindLog pages. We're concerned that some folks who've been taught that “higher is better” could find the relationship between their Lectical Scores and these typical trajectories disheartening. On the other hand, plotting their scores along these trajectories appears help many people set realistic learning goals for themselves—with practices that help them keep learning in their current learning sweet spots (AKA Goldilocks Zones or growth edges).
Being able to communicate in words is an important life skill. Learning how to do this well enough to share our thoughts, feelings, and ideas with others is obviously of great importance, and the practice of communicating in speech and writing is a major way we build our minds. Lectical Scores represent the complexity level of our thoughts as they are expressed in words. These scores are useful, especially when it comes to observing mental growth, but they do not, in any way, “sum us up.”
Here are a few things to keep in mind if you decide to plot your MindLog scores on this graph.
- You'll need to plot several years of growth before a clear trajectory is likely to appear.
- Your scores are likely to straddle two curves—more if you don't always do your own writing or you write in diverse knowledge areas.
- Your current trajectory is not necessarily your destiny. Many things influence the rate of an individual's growth.
- Scoring higher on the Lectical scale is not an indicator of a general level of competence. People tend to receive higher scores in their areas of expertise—as long as these areas of expertise require the ability to explain one's thinking.
- Some skill areas do not require the kind of explicit knowledge that is readily communicated in words.